
• Turkey’s total fuel consumption could rise to 129 million tons by 2053—more than four times the 2024 level.
• Greater EV penetration is consistently associated with a reduction in oil import growth, but even ambitious adoption rates only slow the increase in demand rather than reversing it.
• Under the Global Warming and Zero Emission scenario, which assumes full electrification of the vehicle fleet, automobile fuel consumption falls to nearly zero. Total fuel demand would reach 60.45 million tons, with crude oil imports at 58.97 million tons.
• The National Transportation Plan scenario (69% EV share) cuts automobile fuel use by 72.9% and crude oil imports by 40.5% relative to the baseline. Nevertheless, overall fuel demand remains well above 2024 levels.
• The World Trend scenario (51.1% EV share) reduces automobile fuel consumption by 53.9% and crude oil imports by 29.9% compared to the baseline, yet total oil demand still exceeds today’s levels.
• The EPDK Medium scenario (32% EV share) lowers automobile fuel consumption by 22.48 million tons and oil imports by 23.34 million tons—an 18.6% decline in crude oil imports compared with the zero-EV growth baseline. Still, total oil imports would increase significantly compared to 2024.
• Across all scenarios, Turkey’s oil import volumes continue to expand, driven by fleet growth and economic development. This highlights that EV adoption is not optional but essential to reduce dependency and enhance energy security.
As of 2024, EVs represent only about 1.1% of Turkey’s total automobile fleet. Although still modest in scale, EV sales have been rising in recent years, reflecting global market trends, technological advances, and shifting consumer preferences. At the same time, the rapid growth of Turkey’s overall vehicle fleet continues to drive up fuel consumption and reinforce the country’s longstanding reliance on imported oil.
This study evaluates, through long-term projections to 2053, the potential impact of increased EV penetration on Turkey’s energy landscape. It provides a comparative assessment of how changes in the share of EVs within the total vehicle fleet, across several scenario frameworks, could influence fuel demand and petroleum import volumes. A second, closely related objective is to measure the scale of Turkey’s oil dependency in order to establish a basis for examining its policy implications. In doing so, the study also considers the broader economic and geopolitical implications of these dynamics, given Turkey’s heavy dependence on imported energy.
The analysis follows a scenario-based approach, drawing on quantitative data from two primary sources: the Ministry of Transport’s 2023 study on EV charging station simulation and location planning, and the Energy Market Regulatory Authority’s (EPDK) 2024 report, Electric Vehicle and Charging Infrastructure Projection. These sources provide estimates of future vehicle growth, EV adoption rates, and infrastructure needs. Their projections were harmonized and extended through 2053 to align with Turkey’s national decarbonization timeline.
The Ministry of Transport outlines three EV adoption scenarios. The National Transportation and Logistics Master Plan scenario envisions Turkey reaching adoption levels comparable to developed countries by 2053. The World Growth Trend scenario aligns Turkey’s EV penetration with global averages, based on International Energy Agency (IEA) data. The Global Warming and Zero Emission Target scenario assumes a full transition to zero-emission vehicles by 2053, consistent with Turkey’s climate commitments. Meanwhile, EPDK presents three scenarios of its own: Low, Medium, and High EV penetration. In addition, a Zero EV Increase baseline scenario assumes no further EV penetration beyond 2024, serving as a reference point to better isolate the impact of expanded EV uptake on fuel consumption and petroleum imports.
This introductory section sets the foundation for the analysis by outlining the methodological approach and reference scenarios. Subsequent sections examine the political and economic implications of Turkey’s external energy relationships.
The determination of total vehicle numbers in this study was based on multiple factors, including historical growth trends, projected developments in the automotive sector, macroeconomic expectations for Turkey, consumer preferences, and the influence of pricing and incentives. These estimates were cross-checked against data from existing published reports, ensuring alignment with established EV scenario analyses. Consequently, the total vehicle stock figures applied here are consistent with those widely used in the broader literature.
It should be stressed that this study did not generate new or original EV adoption forecasts. Instead, it directly incorporated external estimates from the referenced scenario studies. In this respect, EV adoption levels were treated as exogenous inputs, with no additional projection modeling undertaken for the EV fleet itself. The central aim was to quantify the implications of these scenario-based EV numbers for Turkey’s future fuel consumption and petroleum import requirements. For consistency with existing literature, the year 2053 was selected as the projection horizon, while historical data up to 2024 served as the baseline reference point.
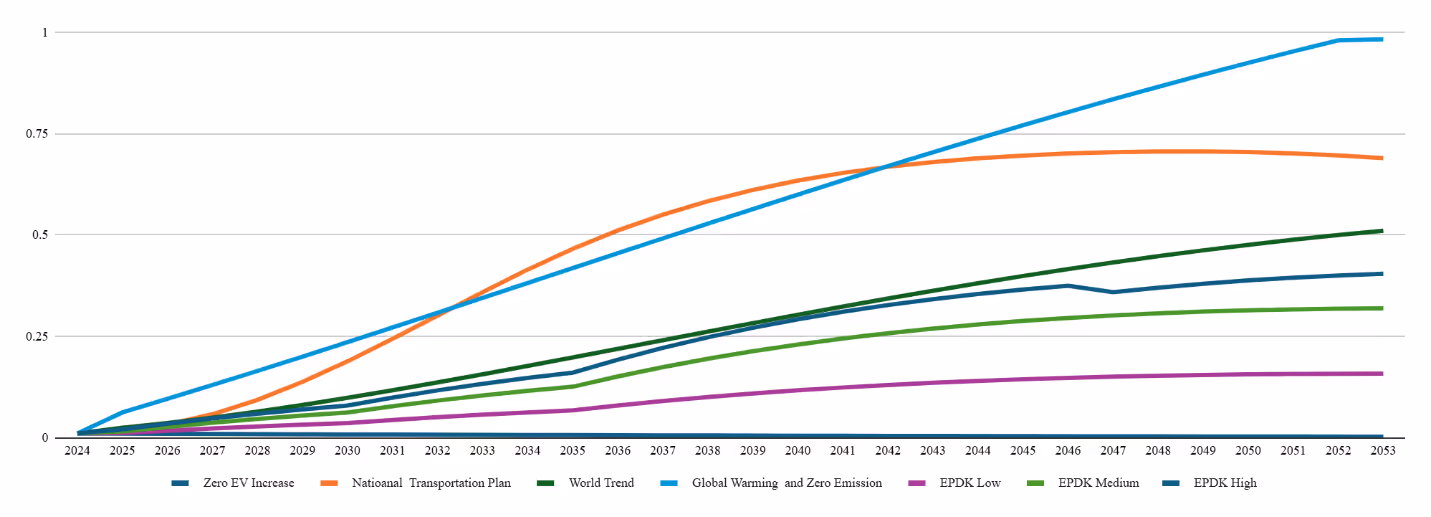
Figure 1 Annual EV Penetration Rate by Each Scenario
The primary objective of this analysis is to estimate the impact of the expected increase in EV penetration in Turkey’s transportation sector on the total fuel consumption of road vehicles and Turkey’s oil imports. Transport modes other than road vehicles, namely rail, air, and maritime, are excluded from the scope of this study due to the negligible or absent presence of EVs in these sectors. Accordingly, the study centers on total automobile numbers and the overall road vehicle stock as the key data points. To ensure more realistic projections, several adjustments were introduced. Most notably, LPG-fueled vehicles were separated from the total automobile figures and considered individually.
This distinction is particularly important in the Turkish context, where LPG vehicles account for a significantly larger share of the passenger fleet than in global markets. As of 2024, approximately 5.2 million LPG-fueled vehicles are in operation in Turkey, representing nearly 32% of total passenger automobiles.1 Given their substantially lower fuel consumption relative to gasoline and diesel vehicles, as well as their distinct market dynamics, LPG vehicles warranted a separate analysis.
Fuel consumption data were obtained from EPDK’s monthly and annual sectoral reports, which provide sales figures for gasoline, diesel,2 and LPG3. Projections for total fuel consumption growth were based on the increase in vehicles other than EVs and LPG-fueled vehicles. In parallel, automobile fuel consumption was projected in proportion to the growth of total passenger vehicles, again excluding both EVs and LPG vehicles.
To isolate automobile-specific fuel consumption from total road transportation fuel consumption, the ratio of non-EV, non-LPG automobiles to the overall vehicle stock was applied, and the projections were adjusted accordingly. It should also be noted that hybrid vehicles (including plug-in and non-plug-in hybrids) were grouped with conventional vehicles for this analysis. No separate estimates or assumptions were developed for hybrids, as the study’s central focus was exclusively on battery-electric, i.e., full electric vehicles.
Establishing a precise, one-to-one relationship between Turkey’s crude oil imports and its domestic fuel sales or consumption is inherently challenging. Several factors complicate this correlation, including imports by distributors and refiners, marine fuel sales, aviation fuel usage, and other market dynamics. Nevertheless, historical data suggest that refined petroleum consumption and crude oil import volumes generally move in close proportion, approximating a 1:1 ratio. Based on this evidence, the study applies a 1-to-1 correlation between refined petroleum consumption and Turkey’s crude oil imports, consistent with historical data series.
This study does not explicitly model the various factors that may influence the pace of EV adoption, such as Turkey’s electricity generation, grid infrastructure, electricity pricing, EV charging station density, dispersion and dissemination, incentives, tariffs, credit programs, or direct investment support measures. Instead, it assumes that these enabling conditions will be provided and sustained in line with the scenario references drawn from existing studies. In other words, the political, regulatory, fiscal, technological, and infrastructure drivers of EV adoption are treated as given, without the introduction of additional variables.
This analysis is based on three key data points and their projected growth: the total passenger car stock, the number of LPG-fueled road vehicles, and the total number of other road vehicles (e.g., commercial vehicles, light trucks, motorcycles).
When estimating the future growth of vehicle numbers, historical trends were evaluated alongside Turkey’s macroeconomic outlook, expected developments in the automotive sector, and data from previous scenario reports. Over the past two decades, passenger car stock in Turkey has grown at an average annual rate of about 5.5%, while over the past decade the rate averaged closer to 5%.4 Taking into account projected economic growth and the likely maturation of the automobile market, a more conservative growth rate of 4.5% was adopted for the base scenario, consistent with the Turkish government’s estimate. To test sensitivity, alternative scenarios with growth rates of 4%, 4.5%, and 5% were also explored. The 4.5% assumption was found to align most closely with other referenced projections.
For LPG-fueled vehicles, historical data indicates an average annual growth of 2.3% over the past 10 years. However, this rate has steadily declined, suggesting the LPG vehicle market is approaching saturation and becoming more stable. Therefore, a baseline growth rate of 1% was assumed for LPG vehicles. Sensitivity tests with growth rates ranging from -3% to +2% showed that even under these variations, the impact on overall fuel consumption remained limited to 2%–3%, partly due to the lower per-vehicle fuel demand of LPG cars.
For the Zero Emission scenario, which envisions a full transition to EVs by 2053, it was assumed that the LPG vehicle stock would decline by 3% annually. However, it is important to acknowledge that a complete disappearance of LPG vehicles is unlikely in practice, since this segment typically represents the most fuel-efficient, cost-sensitive, and price-conscious consumers. Accordingly, a more modest 1% growth assumption is considered realistic under most scenarios.
For vehicles outside the passenger car category, growth was assumed at 4% annually—slightly below the historical average of 5%–5.5%—to reflect anticipated shifts in the transport sector and the broader effects of EV adoption.
In summary, this report assumes an annual growth rate of 4.5% for automobiles (aligned with the Turkish government’s estimate), 4% for other vehicles, and 1% for LPG-fueled vehicles, while projecting a 3% annual decline in LPG vehicles under the Zero Emission scenario. This decline reflects the expected phase-out of LPG under a fully electrified transport policy. The baseline year is 2024, with total fuel consumption at 36.7 million tons, of which 17.3 million tons are attributed to automobiles. LPG vehicles—representing approximately 32% of Turkey’s car fleet—are analyzed separately due to their distinct consumption patterns and their disproportionate significance in Turkey’s automobile market compared to global norms.
Key variables influencing these projections include government policy interventions (such as incentives and regulations), market demand and consumer behavior, technological advancements in battery efficiency, safety and cost, the expansion of charging infrastructure and advancement of grid infrastructure, macroeconomic stability, and global supply chain dynamics. Additionally, regional disparities, energy price fluctuations, and unforeseen innovations could significantly influence adoption trends. While these factors introduce uncertainty, acknowledging them provides a more comprehensive understanding of future oil demand and the broader transition to sustainable transportation—core considerations underpinning this study.
This study draws on two principal reports to estimate the current and projected total number of vehicles and EVs in Turkey. The first is the 2023 report by the Ministry of Transport, which focuses on the optimal siting of EV charging stations and the development of a simulation program.5 The second is the 2024 publication by the EPDK.6
Both studies primarily aim to forecast the optimal number and geographic distribution of EV charging stations in parallel with the anticipated growth of the EV market. Among them, the Ministry of Transport’s report is notable for its comprehensiveness and extensive stakeholder engagement. It evaluates the current state of the EV sector, provides analytical projections, and outlines policy recommendations to support further expansion.
In its report, the Ministry of Transport developed three distinct scenarios for EV adoption through 2053:
This scenario is grounded in the National Transportation and Logistics Master Plan and reflects growth levels consistent with developed countries. EV projections are derived by correlating target-year vehicle kilometers traveled with estimated EV adoption rates, leveraging historical sales data, market growth trends, and advanced statistical modeling techniques.7
This scenario estimates Turkey’s EV growth by aligning it with global sales trends. Data from the IEA and other global market sources were analyzed and mapped against Turkey’s market conditions. The projection assumes Turkey will follow the global average EV penetration trajectory, adapting international growth rates to the national context.8
This scenario is aligned with Turkey’s 2053 Net Zero Emission Goal. Projections are based on the emission-reduction targets outlined in the Climate Council Final Declaration, modeling a gradual phase-out of internal combustion engine (ICE) vehicles in favor of EVs. The adoption curve is accelerated to meet decarbonization targets, with the ultimate aim of a fully electrified vehicle fleet by 2053.9
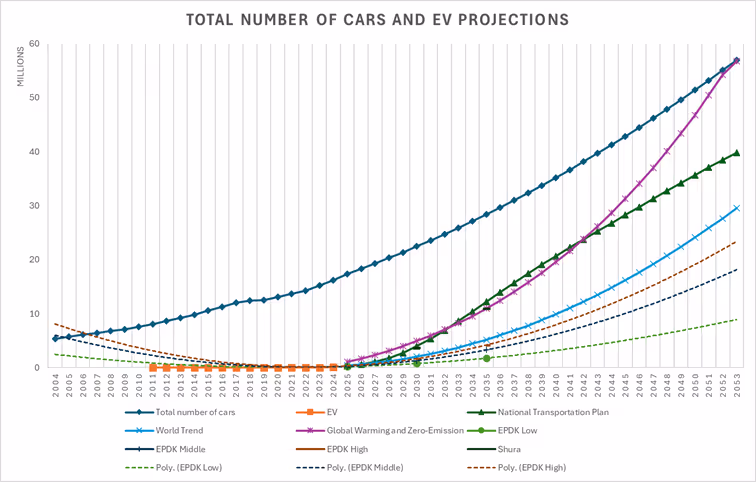
Figure 2 Total Number of Cars and Projected EV Vehicles
The EPDK report provides a complementary perspective by modeling EV adoption under three scenarios—Low, Medium, and High—using a combination of quantitative and qualitative factors: 10
● Existing Vehicle Stock and Growth Trends: Historical data from the Turkish Statistical Institute (TURKSTAT) was analyzed and projected forward.
● International EV Market Growth Rates: Adoption trajectories from mature EV markets were examined and adjusted to reflect Turkey’s conditions.
● Market Dynamics and Electrification Rates: Sales projections from vehicle manufacturers and importers were incorporated into EV penetration estimates.
● Demographic and Economic Indicators: Urbanization, income levels, population density, and transport infrastructure were factored in to assess regional adoption potential.
● Government Policies and Incentives: Anticipated policy measures and evolving consumer preferences were included to capture possible acceleration in EV uptake.
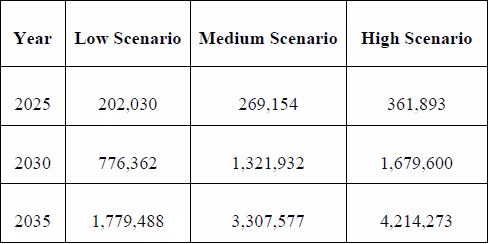
Drawing on these variables, EPDK projected EV adoption for 2025, 2030, and 2035 under the three scenarios, as summarized below:11
The table below compares projected EV numbers and penetration rates for 2053, as estimated by both the Ministry of Transport and EPDK:
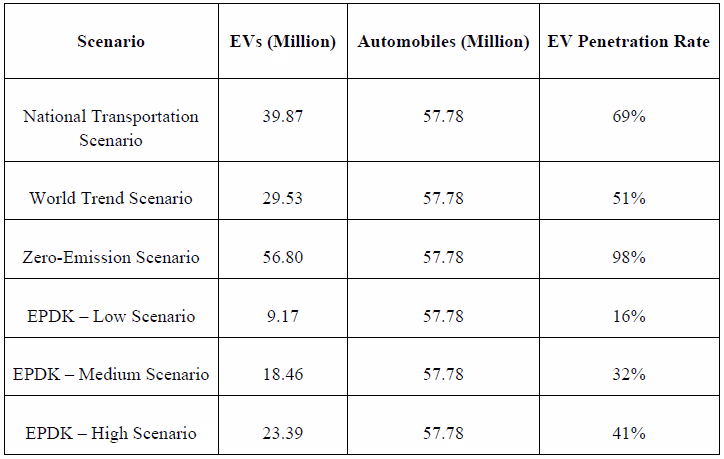
The Ministry of Transport’s National Transportation and Logistics Master Plan and Zero-Emission scenarios point to higher levels of EV adoption, suggesting an ambitious transition strategy. In contrast, EPDK’s scenarios are more conservative, emphasizing potential constraints such as market readiness, economic conditions, and policy uncertainties.
According to data from the EPDK, Turkey relies heavily on a small group of countries for its crude oil imports. In 2024, the country’s daily crude oil production averaged about 127,000 bpd, while imports of crude oil and refined products approached 1 million bpd.12 That same year, Russia accounted for 56.4% of Turkey’s total imports, followed by Iraq (15.8%) and Kazakhstan (9.8%).13 Together, these three suppliers provided more than 80% of total imports. Other contributors—including Saudi Arabia, Nigeria, and Norway—supplied much smaller shares.
Figure 3 Turkey’s Crude Oil Imports, EPDK (2024)

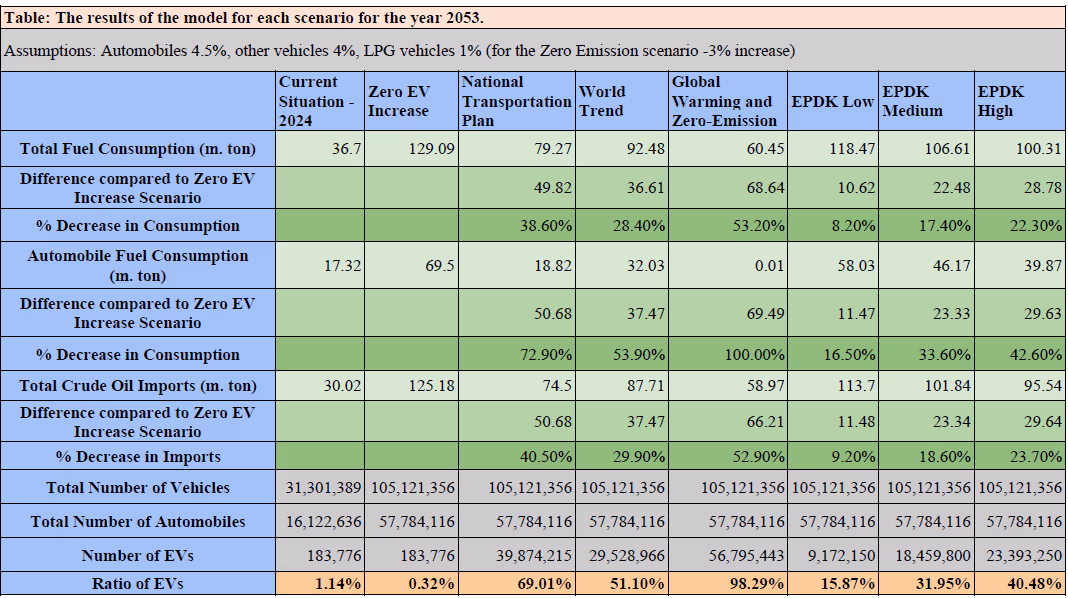
In the Zero EV Increase scenario, total fuel consumption in 2053 is projected to rise dramatically to 129.09 million tons. This represents the business-as-usual trajectory in which EV adoption remains stagnant, with only about 184,000 EVs on the road (0.32% of the car fleet). Under this scenario, automobile fuel consumption alone would reach 69.50 million tons, while crude oil imports would climb to 125.18 million tons annually. Such dependence would pose a serious challenge to Turkey’s energy security and place significant pressure on its current account balance.
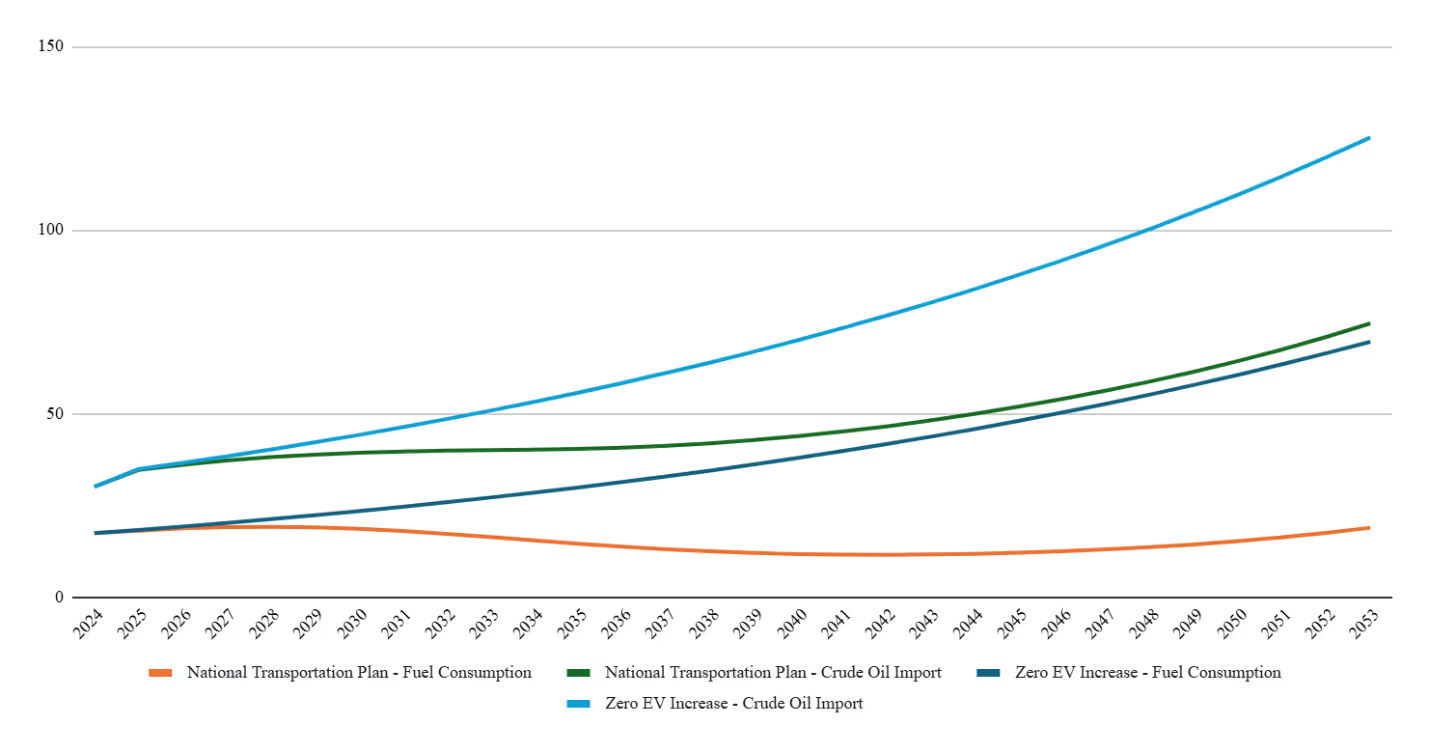
By contrast, the National Transportation Plan scenario—which assumes approximately 69% EV penetration—reduces total fuel consumption to 79.27 million tons. This translates into savings of 49.82 million tons compared to the Zero EV Increase scenario, amounting to a 39% reduction in crude oil imports (from 125.18 million tons down to 74.50 million tons). Under this scenario, automobile fuel consumption is projected at just 18.82 million tons, a reduction of 50.68 million tons—equivalent to a 72.9% decline. These results highlight the potential of targeted policy measures and coordinated infrastructure development, when pursued under a comprehensive national plan, to fundamentally reshape fuel demand.
Figure 4 National Transportation Plan vs. Zero EV Increase: Fuel Consumption and Crude Oil Imports
The World Trend scenario, which assumes Turkey’s EV market evolves in line with global sales trends, projects total fuel consumption of 92.48 million tons in 2053—36.61 million tons lower than the Zero EV Increase baseline. Automobile fuel consumption is expected to fall to 32.03 million tons, a reduction of 37.47 million tons (54%). Crude oil imports would decline to 87.71 million tons, about 29.9% below the zero-growth baseline. While its impact is not as dramatic as the National Transportation Plan scenario, the World Trend scenario still represents a substantial improvement in energy resilience.
Figure 5 World Trend vs. Zero EV Increase: Fuel Consumption and Crude Oil Imports

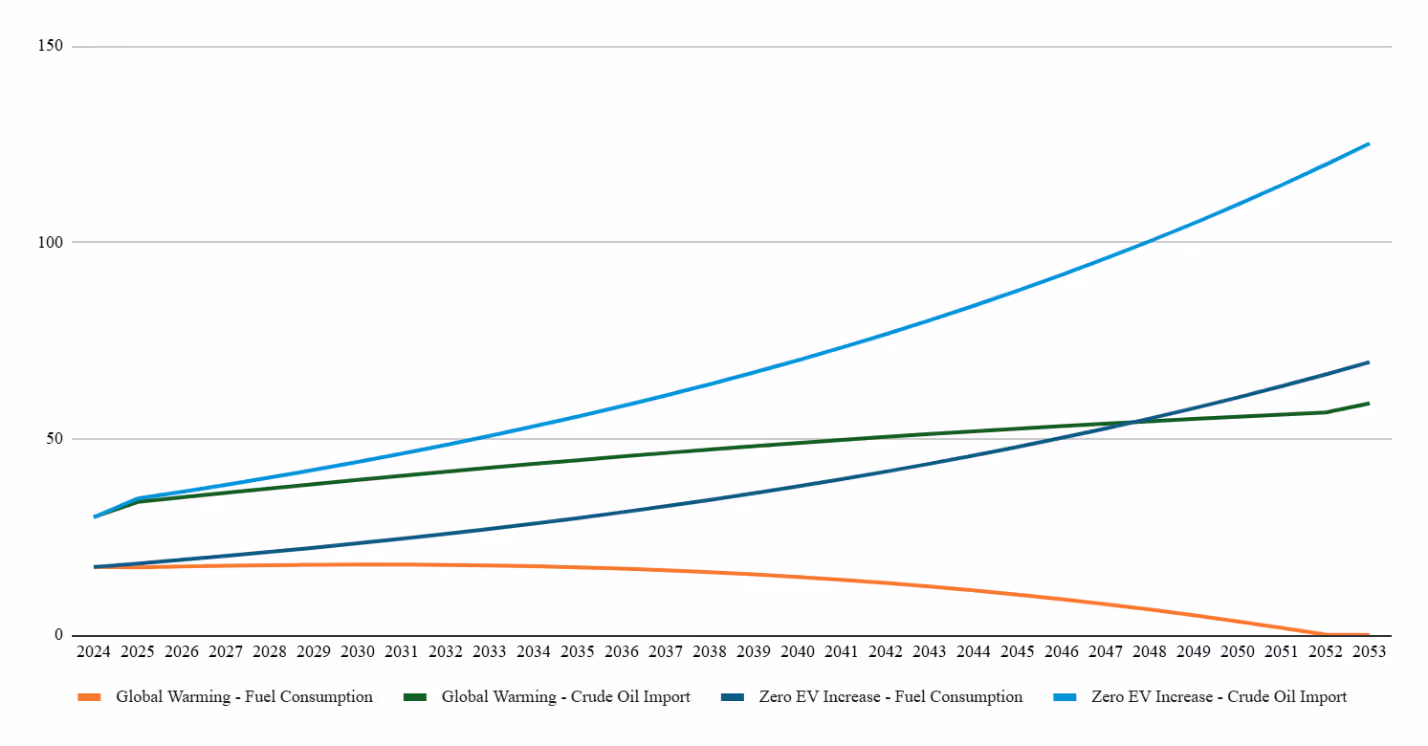
The Global Warming and Zero Emission scenario demonstrates the most transformative outcomes. Under this scenario, EV adoption reaches nearly 100% (98.3% share of the market), effectively eliminating automobile fuel consumption—reducing it to just 0.01 million tons. As a result, total fuel consumption falls to 60.45 million tons, 68.64 million tons lower than the Zero EV Increase scenario, representing a 53.2% reduction. Crude oil imports also fall sharply to 58.97 million tons, 66.21 million tons below the baseline, or 52.9% lower. These results underline the extraordinary potential of an aggressive decarbonization strategy to restructure Turkey’s energy balance.
Figure 6 Global Warming vs. Zero EV Increase: Fuel Consumption and Crude Oil Imports
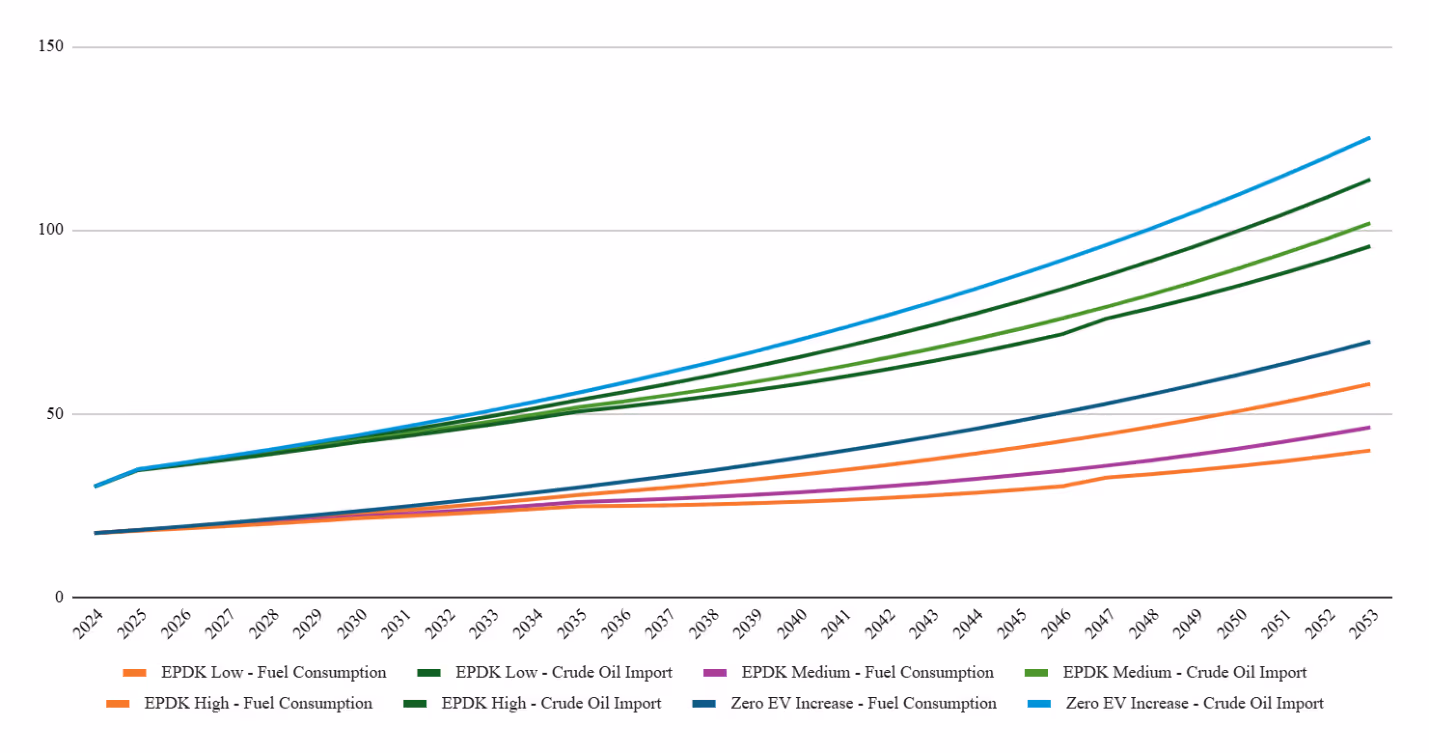
Among the EPDK scenarios, more moderate pathways were considered. The EPDK Low scenario, with EV market penetration reaching 15.9%, projects total fuel consumption of 118.47 million tons—only 10.62 million tons lower than the zero-growth case (9.2% decrease in crude imports). Automobile fuel consumption in this scenario is estimated at 58.03 million tons, representing a decline of just 11.47 million tons. These results indicate that limited EV adoption provides only marginal relief to fossil fuel demand.
The EPDK Medium scenario, with a 31.9% EV share, shows a more meaningful impact. Total fuel consumption is projected at 106.61 million tons—22.48 million tons below the Zero EV Increase baseline in 2053. Automobile fuel consumption would fall to 46.17 million tons, a reduction of 23.33 million tons (about 33.6%). Crude oil imports under this scenario are estimated at 101.84 million tons, 18.6% lower than the baseline.
The EPDK High scenario, with EV market penetration rising to 40.5%, projects total fuel consumption of 100.31 million tons—28.78 million tons less than the Zero-EV increase case. Automobile fuel consumption would decline to 39.87 million tons, 42.6% below the baseline. Crude oil imports in this scenario would reach 95.54 million tons, representing a reduction of 29.64 million tons, or approximately 23.7%, compared to a no-EV scenario.
Figure 7 EPDK vs. Zero EV Increase Scenarios: Fuel Consumption and Crude Oil Imports
Across all scenarios, the pattern is clear: higher EV adoption leads to larger reductions in fuel consumption growth and oil imports. The contrast between the zero-growth scenario and the Global Warming/Zero Emission scenario is particularly striking. Near-complete electrification eliminates automobile fuel consumption entirely and delivers more than 66 million tons of annual crude oil import savings.
The National Transportation Plan scenario also demonstrates impressive gains, with crude oil imports reduced by nearly 50.7 million tons and automobile fuel demand declining by 72.9%. Even the more moderate EPDK Medium scenario achieves a meaningful outcome, cutting automobile fuel use by one-third and reducing crude oil imports by over 23.3 million tons in 2053.
It is also important to note that the total number of vehicles is held constant across all scenarios—about 105 million in total (in 2053), including 57.8 million automobiles—thereby isolating the effect of EV adoption. This means that the observed fuel savings do not arise from reducing the number of cars, but purely from changing the fuel mix of the fleet.
The results highlight a transformative opportunity for Turkey’s energy policy and climate ambitions. Under the Zero EV Increase scenario, Turkey’s total fuel consumption nearly quadruples by 2053 compared to current levels, driven by both growth in the vehicle stock and continued reliance on fossil fuels. In contrast, the Zero Emission scenario, supported by full electrification of the vehicle fleet, not only halts this growth but reverses it, reducing total fuel consumption to levels even lower than in 2024. The complete elimination of automobile fuel consumption in this scenario signifies a radical shift, with profound implications for Turkey’s oil import bills, current account balance, and geopolitical energy security.
The National Transport scenario also demonstrates significant progress, capping automotive fuel consumption at under 19 million tons by 2053 despite the growth in the vehicle fleet. This underscores the powerful role of targeted policies and planning—such as charging infrastructure, incentives, and public awareness—in reducing dependence on fossil fuels. The World Trend scenario, which assumes Turkey follows global average adoption rates, still achieves a reduction of more than 53% in automotive fuel consumption and a cut of roughly 37.5 million tons in crude oil imports by 2053, representing a significant improvement over the status quo.
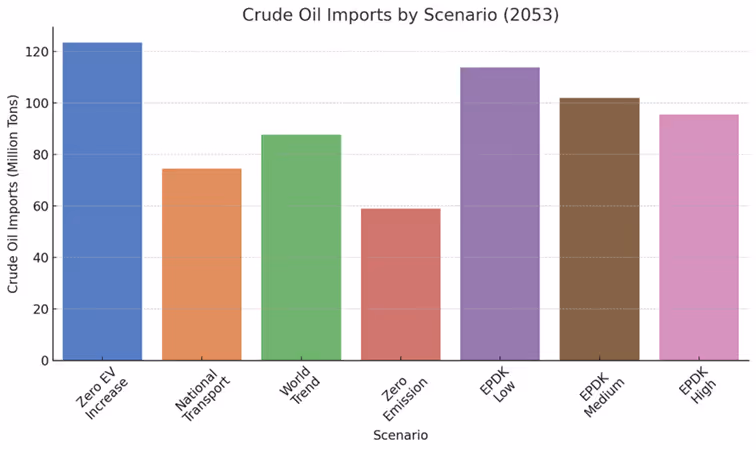
Figure 8 Crude Oil Imports by Scenario (2053)
Even in EPDK’s scenarios, the more conservative forecasts yield meaningful benefits. For example, the low scenario—with just 16% EV penetration—reduces crude oil imports by 11.5 million tons and automobile fuel consumption by approximately 16.5%. The medium and high scenarios, assuming 32% and 41% penetration respectively, deliver proportionally greater gains, offering a clear roadmap for intermediate steps on the journey to full electrification.
To better understand the potential pathways available to Turkey, it is imperative to examine the experiences of countries currently at the forefront of EV adoption—whether through industrial capacity, technological advancement, or policy effectiveness. In the following section, we briefly highlight Norway, China, and the United States as instructive models, each demonstrating distinct approaches and outcomes.
Norway stands as the global benchmark for EV adoption. In 2024, EVs accounted for nearly 90% of new vehicle sales—by far the highest proportion worldwide.14 By the same year, approximately 30% of all passenger vehicles on Norwegian roads were electric, marking a profound transformation of the national fleet.15 This success is the outcome of a comprehensive and sustained policy framework that combines strong incentives for EV adoption with financial disincentives for ICE vehicles.16
Norway’s multi-faceted incentive package includes direct subsidies for EV purchases; exemptions or reductions in road tolls, ferry fees, and parking charges; and access to bus and taxi lanes, which enhances commuting efficiency. At the same time, high taxation on petrol and diesel vehicles has made ICE ownership significantly more expensive.17 Together, these “carrot and stick” policies have reshaped consumer preferences and market dynamics, positioning EVs as the default choice for new car buyers.
A key enabling factor is Norway’s considerable financial capacity. With a sovereign wealth fund exceeding $1.3 trillion, derived primarily from petroleum revenues, the country has had both the fiscal flexibility and political consensus to invest heavily in EV infrastructure and consumer incentives. This economic strength has allowed Norway to sustain its transition without creating undue strain on the public budget.18
The environmental impact is already evident. According to the IEA, Norway’s road transport oil consumption declined by 12% between 2021 and 2024, directly reflecting the country’s high EV penetration.19 This decline underscores the tangible environmental benefits of rapid electrification, particularly in terms of cutting greenhouse gas emissions and improving urban air quality.
The electricity-generation portfolio of Norway also helps shape consumer preferences. Norway is one of the countries that utilize renewable energy—especially hydroelectric—extensively in their electricity-generation portfolios, which supports the idea of owning an EV and contributing to the environment. This is not entirely the case in other countries.
China has firmly established itself as the global leader in EV adoption and production. In 2024, the country accounted for more than 11 million of the 17.1 million EVs sold worldwide—over half of global sales.20 EVs now comprise nearly 50% of new vehicle registrations in China, a sharp rise from just 6% in 2020.21,22 According to the IEA, EVs currently represent around 10% of all cars on Chinese roads.23
This transformation is part of a broader national strategy to reduce reliance on foreign oil and to be a pioneer in battery energy storage manufacturing. After decades of rising oil consumption, China is projected to reach peak demand by 2027, followed by a gradual decline.24 Although the country still imports approximately 11 million barrels of oil per day—about 70% of its total consumption—the shift toward electrification is beginning to bend the curve.25
China’s rapid EV adoption reflects the long-term impact of sustained state intervention and industrial policy. Its dominance in the sector is no accident, but rather the outcome of more than a decade of strategic policymaking. Between 2009 and 2023, the Chinese government invested approximately $231 billion in EV-related support,26 including tax exemptions, procurement incentives, and subsidies for infrastructure and R&D. The sales tax exemption program alone is estimated to have cost over $100 billion since 2018.27
Initially, this aggressive policy mix sparked a wave of new entrants, with nearly 500 companies competing in the EV market—many lacking the technical expertise to succeed.28 The recent unveiling of ultra-fast charging technologies by firms such as BYD, along with the rollout of over 14 million charging points nationwide (nine times the number in 2020), underscores the depth of the country’s commitment.29
The results have been transformative. BYD has surpassed Tesla as the world’s largest EV producer, and while Chinese manufacturers now face challenges of overcapacity and domestic price wars, they are increasingly exporting to global markets.30
Despite being home to Tesla—the company widely credited with sparking the global EV revolution—the United States continues to lag in EV adoption, infrastructure development, and market penetration. In the first half of 2025, EVs accounted for approximately 7.5% of all new car sales in the U.S., totaling 607,089 units. This reflects only a 1.5 percentage point increase from the previous year.31 Notably, Q2 2025 saw a 6.3% decline in EV sales compared to the same period in 2024, indicating emerging volatility in consumer demand.
A temporary surge is expected in Q3 2025 as buyers rush to take advantage of federal tax credits set to expire on October 1.32 Yet, despite rising sales, EVs still account for just 1.5% of the total vehicle stock in the U.S.—a figure far below that of China and several leading European markets.33
The U.S. EV market remains heavily dominated by Tesla, although traditional automakers are gradually expanding their presence. General Motors, for instance, nearly doubled its EV sales in Q1 2025 compared to the same period in 2024, reflecting growing momentum among legacy players.34 However, U.S. automakers continue to face structural challenges, including affordability, inadequate charging infrastructure, and supply chain constraints in battery production. These issues collectively slow market expansion and limit the nation’s ability to compete globally in EV manufacturing and sales.
Federal tax credits and state-level initiatives—most notably in California—have spurred incremental growth. However, these measures have not generated a nationwide transformation on the scale observed in China.
The key difference lies in policy design: China’s strategy has been vertically and horizontally integrated, combining consumer support and producer incentives with substantial infrastructure investment. By contrast, U.S. policy has been more fragmented, decentralized, and vulnerable to political shifts. President Donald Trump has publicly expressed skepticism toward federal support for electrification and has rolled back certain subsidies.35
Such policy uncertainty casts doubt on the long-term viability of existing incentives and risks discouraging both consumer confidence and private investment. Moreover, the partisan framing of EV adoption has polarized public opinion, weakening the social and political consensus needed to drive a broad-based transition.
The electrification of Turkey’s transport sector presents a critical opportunity to reduce dependence on imported oil. However, projections in this study indicate that Turkey’s total energy demand is expected to rise sharply in the coming decades. Modeling shows that oil imports will continue to grow in absolute terms under all EV adoption scenarios. Even with high levels of EV penetration, total energy consumption could nearly double by 2053. A medium EV penetration rate (32% by 2053) could lower crude oil imports by more than 22 million tons annually. Under a full electrification scenario, automobile fuel consumption would fall close to zero, saving 69 million tons of fuel each year and reducing crude oil imports by over 64 million tons. In the EPDK Medium and High scenarios, imports still climb to 102 and 96 million tons, respectively. In the “Zero EV Increase” case, crude oil imports would reach 123 million tons by 2053—more than four times the 2024 level.
If Turkey does not pursue EV adoption, its oil import bill will rise dramatically, more than quadrupling by 2053 under the baseline scenario. While oil can be sourced flexibly on global markets, such a sharp increase in import volumes would heighten Turkey’s exposure to external shocks, price volatility, and geopolitical risks in supplier regions. This dependence would limit Ankara’s foreign policy options, as any disruption could carry serious economic costs and weaken its regional influence.
To reduce its increasing energy dependency, Turkey should actively embrace EV adoption—not only to ease the burden of oil imports but also to strengthen energy security and economic resilience. A carefully managed transition, supported by investment in charging infrastructure, grid strengthening, domestic manufacturing of EVs and their components, reliable electricity generation, and an accompanying transition in the electricity generation mix would give Turkey greater control over its energy future.
That said, EV adoption comes with trade-offs. Greater reliance on EVs will inevitably increase electricity demand. As the vehicle fleet grows from 31 million to more than 105 million, the shift from fossil fuels to electricity will place significant pressure on Turkey’s power system in terms of generation, transmission, and the distribution grid.
It is important to note that fuel consumption, and consequently crude oil imports, continue to increase under all scenarios. This means Turkey’s refining sector is expected to face growing capacity deficits in the coming decades, requiring a growing share of refined products to be imported directly. This trend underscores the urgency of investing in new refining capacity or expanding existing facilities, which would help reduce Turkey’s exposure to external supply shocks and ease its import burden.
In summary, the analysis underscores that ambitious EV penetration policies can transform Turkey’s future energy balance. While modest adoption yields incremental benefits, only high or near-total electrification pathways have the capacity to fundamentally reduce dependence on imported petroleum to be used for automobiles, fully aligning with Turkey’s climate objectives and economic security goals.
The primary objective of this study was to assess the potential impact of EV adoption on Turkey’s fuel consumption and, by extension, its dependence on energy imports, primarily oil imports. The modeling results highlight a wide range of outcomes. A full electrification pathway would virtually eliminate automobile fuel consumption, saving more than 64 million tons of oil imports annually.
These benefits, however, must be weighed against the reality that Turkey’s oil demand is projected to rise sharply. Even under high EV penetration scenarios, total fuel consumption could nearly double by 2053—driven largely by a tripling of the vehicle stock, from 31 million to over 105 million.
How Turkey manages this transition will be decisive. It is not only the final penetration rate of EVs that matters, but also the sequence, design, and quality of supporting policies, and the reshaping of the electrical generation mix. If EV penetration and required charging infrastructure are integrated with clean energy sources or nuclear and supplemented with grid enhancements, the benefits will extend beyond oil substitution, contributing to electricity market resilience and lower emissions. Conversely, if the EV-related increase in electricity demand is met primarily through imported natural gas or coal, this will limit the EV penetration rate and its potential benefits.
China’s experience offers valuable lessons. Through a state-driven EV energy storage systems strategy backed by heavy investment on both the supply and demand sides, China has reshaped its domestic market and reduced future oil dependency. Turkey, though smaller in scale, also possesses key strengths: a well-established automotive sector, a young and adaptable population, and an urgent need to reduce its oil import burden. The launch of TOGG, its first domestic EV brand, marks a symbolic beginning. Yet, significant challenges remain. TOGG’s dominance—bolstered by government support—has not yet fostered a vibrant, competitive EV ecosystem. Without broader industrial diversification, greater private sector involvement, and depoliticized market development, Turkey is facing early adoption risks and the possibility of losing momentum.
The report shows that increasing EV penetration offers clear potential benefits for Turkey’s transportation sector and can ease the burden of oil imports to various extents depending on each scenario. However, these benefits will depend on the pace of infrastructure development, the electricity generation mix, and policy support. Realizing these gains requires significant investment in charging infrastructure, supportive regulations that foster favorable market conditions, and the integration of renewable energy into the power system. Moreover, factors such as consumer adoption rates, technology costs, and global energy market volatility may also shape the overall success of the EV adoption strategy.
While increasing EV penetration can help reduce fuel consumption and ease oil import dependency, its impact on Turkey’s overall energy security and energy balance should not be expected to be substantial on its own. Enhancing energy security is a much broader objective that goes beyond the expansion of EVs in the transport sector. For EV adoption to make a meaningful contribution to energy security, it must be embedded within a broader and consistent energy security strategy that prioritizes resource diversification, robust infrastructure and technology, economic sustainability, geopolitical stability, and an appropriate environmental and political framework.
Baki Kaya is an economist, energy expert, and former diplomat. He holds a master’s degree in International Relations and International Economics from the Johns Hopkins University School of Advanced International Studies (SAIS).
Ömer Güler is an economist and former Turkish diplomat. He is a member of InstituDE and holds a master’s degree in International Economics from the Graduate Institute of International and Development Studies in Geneva. He was also a Marshall Memorial Fellow (2015) of the German Marshall Fund.
Harun Güngör is a former Turkish diplomat and State Planning Expert. He earned a master’s degree in International Studies from the North Carolina State University and a bachelor’s degree in Business Administration from Hacettepe University in Turkey.
Mustafa Enes Esen is a former Turkish diplomat and a member of InstituDE. He received his master’s degree from Georgetown University and specializes in Turkish foreign policy, the Middle East, and international security.
1 “Motorlu Kara Taşıtları, Haziran 2025,” Türkiye İstatistik Kurumu (“Motor Land Vehicles, June 2025,” Turkish Statistical Institute), July 18, 2025, https://data.tuik.gov.tr/Bulten/Index?p=Motorlu-Kara-Tasitlari-Haziran-2025-54042.
2 “Petrol Piyasası Yıllık Sektör Raporu Listesi (Annual Sector Report List for the Petroleum Market),” EPDK (Energy Market Regulatory Authority), accessed August 12, 2025, https://www.epdk.gov.tr/Detay/Icerik/3-0-107/yillik-sektor-raporu.
3 “LPG Piyasası Yıllık Sektör Raporu Listesi (Annual Sector Report List for the LPG Market)," EPDK (Energy Market Regulatory Authority), accessed August 12, 2025, https://www.epdk.gov.tr/Detay/Icerik/3-0-108-1002/lpgyillik-sektor-raporlari.
4 “Trafiğe kayıtlı otomobillerin yakıt cinsine göre dağılımı, 2004-2025,” Türkiye İstatistik Kurumu (Distribution of cars registered to the traffic according to fuel type, 2004-2025, Turkish Statistical Institute) https://data.tuik.gov.tr/Bulten/DownloadIstatistikselTablo?p=aw9q1W2VTQei/29HEQS9IDpSRwleWNZKANTHwTLtp32KEOW8YgyTEWzMDZQOWPKk
5 Ministry of Transport and Infrastructure. Elektrikli Araç Şarj İstasyonlarının Yer Seçiminin Belirlenmesi ve Simülasyon Programının Oluşturulması (Determination of the Location Selection of Electric Vehicle Charging Stations and Development of a Simulation Program). 2023. https://www.uab.gov.tr/uploads/pages/bakanlik-yayinlari/elektrikli-arac-sarj-istasyonlarinin-yer-seciminin-belirlenmesiprojesi.pdf.
6 “Elektrikli Araç ve Şarj Altyapisi Projeksiyonu,” (Electric Vehicle and Charging Infrastructure Projection), EPDK (Energy Market Regulatory Authority), August 5, 2024, https://www.epdk.gov.tr/Detay/Icerik/4-14379/elektrikli-arac-ve-sarj-altyapisi-projeksiyonu-.
7 Elektrikli Araç Şarj İstasyonlarının Yer Seçiminin Belirlenmesi ve Simülasyon Programının Oluşturulması, (Determination of the Location Selection of Electric Vehicle Charging Stations and Development of a Simulation Program) 171–79.
8 Ibid., 179–191.
9 Ibid., 191-202.
10 “Elektrikli Araç ve Şarj Altyapısı Projeksiyonu (Electric Vehicle and Charging Infrastructure Projection), (EPDK (Energy Market Regulatory Authority),” August 5, 2024. https://www.epdk.gov.tr/Detay/Icerik/4-14379/elektrikli-arac-ve-sarj-altyapisi-projeksiyonu-, 4–7.
11 Ibid., 7–8.
12 Nevzat Devranoglu, “Estimated 6 Billion Barrel Shale Oil Reserve in Southeast Turkey, Minister Says,” Reuters, May 21, 2025, https://www.reuters.com/business/energy/estimated-6-billion-barrel-shale-oil-reserve-southeast-turkey-minister-says-2025-05-21/.
13 “Petrol Piyasası Yıllık Sektör Raporu (Annual Petroleum Market Report).”
14 Nerijus Adomaitis, “In Norway, Nearly All New Cars Sold in 2024 Were Fully Electric,” Reuters, January 2, 2025, https://www.reuters.com/business/autos-transportation/norway-nearly-all-new-cars-sold-2024-were-fully-electric-2025-01-02/.
15 Sam Meredith, “I’m in Norway — and EVs Are Everywhere. Here’s What the Country Has Done Differently,” CNBC, July 15, 2025, https://www.cnbc.com/2025/07/15/evs-are-everywhere-in-oslo-heres-what-norway-has-done-differently.html.
16 “Norway’s Evolving Incentives for Zero-Emission Vehicles,” OECD, November 6, 2022, https://www.oecd.org/en/publications/ipac-policies-in-practice_22632907-en/norway-s-evolving-incentives-for-zero-emission-vehicles_22d2485b-en.html.
17 “Norwegian EV policy,” Norsk elbilforening (The Norwegian Electric Vehicle Association), accessed August 12, 2025, https://elbil.no/english/norwegian-ev-policy/.
18 Joe Finnerty, “GRIDSERVE | Why Norway Leads the World in EV Adoption,” GRIDSERVE, February 25, 2025, https://www.gridserve.com/why-norway-leads-the-world-in-ev-adoption/.
19 “Global EV Outlook 2025: Expanding Sales in Diverse Markets,” International Energy Agency, 2025. https://iea.blob.core.windows.net/assets/7ea38b60-3033-42a6-9589-71134f4229f4/GlobalEVOutlook2025.pdf, 17.
20 Alessandro Parodi, “Global Electric Vehicle Sales up 25% in Record 2024,” Reuters, January 14, 2025, https://www.reuters.com/business/autos-transportation/global-electric-vehicle-sales-up-25-record-2024-2025-01-14/.
21 Jiri Opletal, “Early Data Shows Record-Breaking 11 Million NEVs Were Sold in China in 2024, Penetration Rate Nearly 50%,” CarNewsChina.Com, January 8, 2025, https://carnewschina.com/2025/01/08/early-data-shows-record-breaking-11-million-nevs-were-sold-in-china-in-2024-penetration-rate-nearly-50/.
22 “Over 17 Million EVs Sold in 2024 - Record Year,” Rho Motion, accessed August 12, 2025, https://rhomotion.com/news/over-17-million-evs-sold-in-2024-record-year/.
23 “Executive Summary – Global EV Outlook 2025 – Analysis,” IEA, accessed August 12, 2025, https://www.iea.org/reports/global-ev-outlook-2025/executive-summary.
24 Alex Lawler and Enes Tunagur, “World Oil Demand to Keep Growing This Decade despite 2027 China Peak, IEA Says,” Reuters, June 17, 2025, https://www.reuters.com/business/energy/world-oil-demand-keep-growing-this-decade-despite-2027-china-peak-iea-says-2025-06-17/.
25 Ciarán Healy et al., “Oil Demand for Fuels in China Has Reached a Plateau – Analysis,” IEA, March 11, 2025, https://www.iea.org/commentaries/oil-demand-for-fuels-in-china-has-reached-a-plateau.
26 Victor De Decker, “EU Tariffs on Chinese Electric Vehicles: From Trade to Investments - Egmont Institute,” EGMONT – The Royal Institute for International Relations, October 11, 2024, https://www.egmontinstitute.be/eu-tariffs-on-chinese-electric-vehicles-from-trade-to-investments/.
27 Brian Spegele, “How China Curbed Its Oil Addiction—and Blunted a U.S. Pressure Point,” Wall Street Journal, July 21, 2025, https://www.wsj.com/world/china/china-oil-demand-lower-b5ae15ed.
28 Trefor Moss, “China Has 487 Electric-Car Makers, and Local Governments Are Clamoring for More,” Wall Street Journal, July 19, 2018, https://www.wsj.com/articles/china-has-487-electric-car-makers-and-local-governments-are-clamoring-for-more-1531992601.
29 Brian Spegele, “How China Curbed Its Oil Addiction—and Blunted a U.S. Pressure Point,” Wall Street Journal, July 21, 2025, https://www.wsj.com/world/china/china-oil-demand-lower-b5ae15ed.
30 Mark Beeson, “Electrifying Geopolitics: Tesla vs BYD,” Lowy Institute, April 7, 2025, https://www.lowyinstitute.org/the-interpreter/electrifying-geopolitics-tesla-vs-byd.
31 Colin Fitzpatrick, “Q2 EV Sales Dip in U.S. as Dealers Brace for Tax Credit Phase-Out,” CBT News, July 15, 2025, https://www.cbtnews.com/q2-ev-sales-dip-in-u-s-as-dealers-brace-for-tax-credit-phase-out/.
32 Ibid.
33 Ronald Montoya, “What Is the Percentage of Electric Cars in the U.S.?,” Edmunds, March 31, 2025, https://www.edmunds.com/electric-car/articles/percentage-of-electric-cars-in-us.html.
34 “U.S. Electric Vehicle Sales Increase More Than 10% Year Over Year in Q1: GM Drives EV Growth While Tesla Declines,” Cox Automotive Inc., April 10, 2025, https://www.coxautoinc.com/market-insights/q1-2025-ev-sales/.
35 Jack Ewing, “Trump’s Order to End E.V. Subsidies Draws Pushback and Doubt,” The New York Times, January 21, 2025, https://www.nytimes.com/2025/01/21/business/trump-ev-subsidies.html.